

Ahead of the April issue report on the underground mine of tomorrow, Sandvik continues to develop and enhance its advanced automation offerings. Transparency of the mining operation has long been a challenge. Sandvik OptiMine® allows you to compare a mine model with the actual layout of your mine and enables continuous improvement in real time.
Sandvik OptiMine is a modular information management solution that offers a real-time view of your underground mining operations. Suitable for all mining applications and the entire mobile fleet, including equipment supplied by other OEMs, the solution is designed to provide real-time tracking and production management tools for controlling both manual and automatic mining operations. Sandvik OptiMine modules can be combined as needed to build up the required functionality and to optimize your mining operations. With open interfaces, the solution can also be integrated to other mine IT systems.
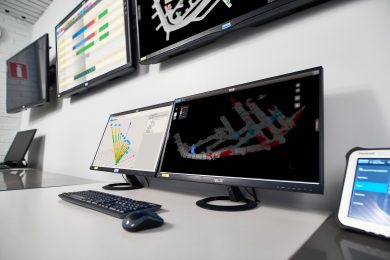
The two latest modules in the offering are the 3D Mine Visualizer and the Drill Plan Visualizer
Based on the 3D scanning results, Sandvik OptiMine 3D Mine Visualizer brings a three-dimensional model of your mine layout directly to your office. 3D mine visualization significantly enhances comprehension of large mining environments. One of the key benefits of 3D mine visualization is how it enables users to more effectively communicate and interpret data around the current situation and future plans for the mining environment.
Situational awareness is improved, as information about the mine can easily be studied and understood at a glance. 3D mine visualization is a valuable tool in operations planning, analyzing problematic areas and tracking mine development over time.
Sandvik OptiMine Drill Plan Visualizer is an easy to use visualization tool for production and rock support drilling.
In the Sandvik OptiMine Drill Plan Visualizer, drill plans and drilling results are visualized in a user-friendly and informative way, giving you the tools you need to compare drilling results to production drilling and bolting plans.
Drilling plans and bolting scenarios can be easily created, modified and edited for the most optimal results. With a web-based user interface, information on the planned and actual drilling is available anywhere, anytime and with virtually any connected device.
Drill plans are transferred to the drill automatically and actual, real-time drilling data is immediately available in the production control system. And, as per other Sandvik OptiMine modules, Drill Plan Visualizer data is available for other mine IT systems.
For production drilling, Sandvik OptiMine Drill Plan Visualizer shows existing plans and actual drilling results in a 3D format, including measurement-while-drilling (MWD) data, when available. MWD data is also available in 2D graphs for more detailed, alternative analysis of the drilling results. The tool’s intuitive user interface ensures that the creation and editing of new drilling plans is convenient and quick.
These two new modules complement the current offering of Sandvik OptiMine® Monitoring and Reporting, Scheduler and Task Management and Location Tracking, which are used in mines in Australia, North and South America, Africa and Europe.