


Metals Focus reports that mine production growth slowed in 2016 to 1.1% as the influence of the project pipeline, built up during the last bull market, continued to wane. “That said, last year’s total of 3,255 t still represented a seventh consecutive all-time high for the sector, and a level that is now nearly one-third higher than a decade ago.
“The 1.1% increase in 2016 was the lowest growth rate since 2008 when mine supply last contracted. Looking back over this period, annual mine supply has now increased by some 800 t, with gains of over 60 t coming from countries such as China, Russia, Mexico, Canada and Australia. Declines have been limited, with South Africa the only producer to record a fall of over 60 t.
“The recent slowdown has largely been caused by the marked fall in project capital expenditure, which occurred since gold prices fell significantly in 2013. But it is the long lead times associated with the mining industry that helps to explain why despite the lower prices in recent years, mine production has continued to grow.
Indeed estimates vary, but the time from discovery to production is often more than ten years. What is more, this is also dependent on many factors, not least the economic viability of the project and companies’ ability to raise finance.
Using MF’s Peer Group Analysis, which tracks an array of financial, cost and production metrics from 12 of the largest gold mining companies (accounting for 30% of World production), shows that following the 2012 peak in total capex of$22.8 Bn, annual expenditure has since fallen by 69% to just $7.0Bn in 2016. Most significantly, expenditure on projects has fallen by 85%, as many of the majors have curtailed development of new production and have instead focused on repaying debt.
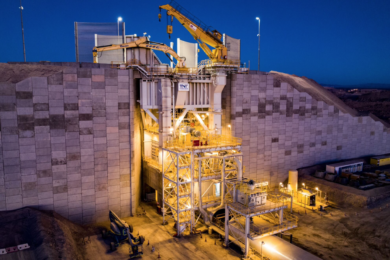
Also worthy of note is that there has not only been a reduction in the number, but interestingly also the size of new mines coming on-line. During 2010-13, an average of 11 new mines, each producing over 3 t/y came on-line, compared with an average of five per year between 2014 and 2016. During 2016, the largest mine starts were Morelos (Mexico) which added 9 t, followed by Obotan (Ghana) with 6 t. Based on an analysis of MF’s global mines database, in total 36 mines entered production last year adding a combined total of some 40 t.
Looking forward, MF forecasts that mine production will again edge higher in 2017, marking the ninth consecutive year of growth. “That said, the year-on-year increase is only anticipated to be marginal, and the near-term outlook for mine supply is more one of equilibrium, as gains from the project pipeline are balanced by ongoing declines at more mature operations. In a continuation of recent trends, growth in 2017 is expected to come from countries such as Suriname, Australia and the USA, as projects that recently entered production ramp-up and deliver their first full year of output.”
Beyond 2017, despite the aforementioned substantial cuts in capital expenditure, MF is not forecasting that global mine supply will markedly contract. “The project pipeline may not be as strong as in previous years but currently operating mines have sufficient reserves and resources to maintain current levels of output.
“The largest 50 gold mines (which account for over 25% of global mine supply) have just over 11 years, on average, of reserve mine life remaining. These mines also have an additional 11 years of mineral resources (exclusive of reserves), which have the potential to be recategorised into reserves.” As of end-2016, MF estimates that global gold mineral reserves stood at 57,300 t (1,842 Moz), with a further 110,100 t (3,540 Moz) classified within the resource category. Of interest, however, is that the average grade processed at primary gold mines during 2016 was 1.44g/t Au, against a mean reserve grade of 1.33g/t Au (7% lower). “The years of 3% per annum growth do now look to be behind us. However with buoyant prices, adequate reserves and a mining industry in a leaner position than in 2013, mine supply looks set to remain at historically elevated levels.
The picture shows El Limon on the Torex Gold’s Morelos gold property, an area of 29,000 ha in the highly prospective Guerrero Gold Belt, located 180 km southwest of Mexico City, in the state of Guerrero. Within this Property, the El Limon-Guajes mine (ELG), located north of the Balsas River, constitutes one of the richest open pit gold deposits at a resource grade of 2.65 g/t Au. The ELG Mine started gold production in December of 2015 and announced commercial production on March 30, 2016. Once in full production, this mine will be amongst the largest and lowest cost gold mines in the world with expected LOM average annual production of 370,000 oz of gold at a LOM AISC of $616/oz. This skarn deposit has measured and indicated resources of 4.12 Moz of gold at a grade of 2.65 g/t Au plus 360,000 oz of gold at a grade of 1.86 g/t in the inferred category. Proven and Probable Reserves, included in the resources, stand at 3.63 Moz of gold at a grade of 2.62g/t.
T