


With the release of the latest version of MICROMINE’s market leading data management solution Geobank 2018 imminent, Geobank Product Strategy Manager Mark Gabbitus recently presented an exclusive preview of some of the key enhancements of the software and how it will benefit the user.“The focus of Geobank 2018 is on usability. We believe that the changes we have made will have a positive impact on our users.”
The planning for Geobank 2018 started back in 2016 with the roadmap based on extensive consultation with the company’s global client base and MICROMINE’s staff. “When we talk about ‘our users’ in Geobank we refer to two main types of users; Database Administrators (DBA’s) and Geobank Users. The changes we have made in Geobank 2018 will have a positive impact on both groups, but some features will have a greater effect on the DBA that the Geobank User.”
Geobank developers have worked hard to enhance the overall aesthetics of Geobank. Where possible, Geobank 2018 uses common icons and graphics similar to Microsoft applications, which makes Geobank 2018 look familiar to users and makes finding options easier and quicker.
Substitution Parameters are used throughout Geobank to control what data is used, displayed or reported when an Object is executed by a Geobank User. It is very common to have Substitution Parameters that are used in multiple objects (Data Views, Reports, Exports etc.) but prior to Geobank 2018 the logic had to be defined manually for each Object. This approach often took a long time, increased the opportunity for errors and made it hard for a user to edit or update an existing Substitution Parameter. “In Geobank 2018 we have added the concept of Global Substitution Parameters that allow the Database Administrator to define a commonly used Substitution Parameter once and assign it to multiple Objects. This will decrease the amount of work a DBA has to do and reduce the potential for errors.”
Like Global Substitution Parameters the addition of Colour Sets in Geobank 2018 allows the DBA to define a colour legend once and use it in multiple functions. Colouring fields, values and maps prior to Geobank 2018 was difficult for the user, so the addition of Colour Sets not only makes the DBA’s job easier it adds benefits to the Geobank User as well. “One area where Colour Sets can really help is in data validation and identifying errors before the data gets to the downstream users such as the Resource Geologist. Not all data errors can be identified by defined business rules. It is common in Geology to have valid data results in the wrong place (ie where a Geologist has incorrectly identified a rock type) and this is best identified visually. Looking at values in a table can be hard on the eyes so being able to colour fields allows the data manager to quickly identify anomalies and correct the data. It is important to identify these errors as the data is being collected and loaded in to the database rather than later in the process, such as when it is loaded into Micromine, because it can be hard to know what to fix.”
Drillhole traces in plan view capability has been added. Being able to see the trace (silhouette) of a drillhole in a plan view is a useful data validation tool for data managers. The ability to see a drillhole was drilled in the right direction (or was recorded correctly) before the data gets to the Resource Geologist is very important.
A folders in the configuration manager enhancement to Geobank 2018 is solely aimed at the DBA as it allows them to manage the Geobank Objects they create more effectively. Being able to store Geobank Objects in named folders allows the DBA to find and edit them more quickly.
A common action for a Geobank User is to run a Report or Data View for a set of data (usually defined by a Substitution Parameter) and make edits or gain insights from the information presented. It is common for the user to want to switch between datasets and prior to Geobank 2018 this involved closing the report and reopening with a new set of Substitution Parameters. Geobank 2018 now allows users to reload the report with new parameters without closing the report down.
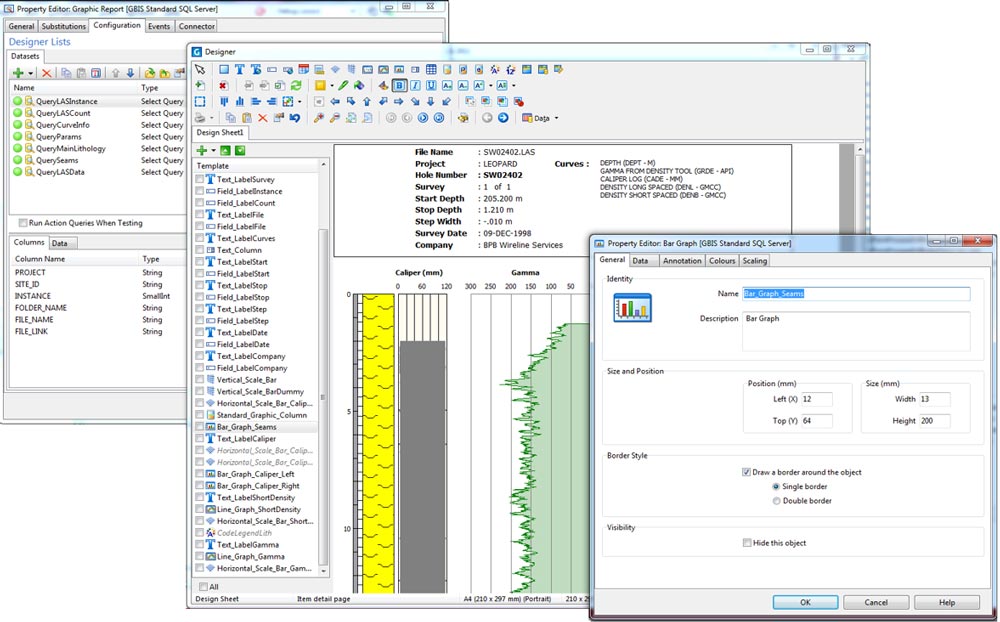
“Graphic Reports are a great feature in Geobank for displaying and sharing the information stored in the database. Our primary mission is to collect and manage drill hole data and one of the best ways to look at this information is in a downhole log report. Geobank’s Graphic Reports are extremely flexible and powerful but prior to Geobank 2018 the setup of a report could be time consuming. With the release of Geobank 2018 we have added numerous features to improve the user experience when designing or editing Graphic Reports. Options such as the Design Grid, Sub-reports and the ability to see and manage dependencies between objects on a Report will significantly reduce the time taken by DBA’s to build and edit reports.” The new Sub-report feature also allows Geobank Users to easily batch plot multiple drillholes in one go. Previously the report template had to be modified per drillhole which increased the work required by the DBA.
In addition to these new features, Geobank 2018 also addresses a number of bug fixes and issues which will aid in improving the overall usability of the product. “These changes will assist to increase efficiency and save time, allowing users to spend more time on analysing and drawing insights from the data, which is the overall objective.”